When reading a paper (vis or otherwise), I tend to read the title and abstract and then jump straight to the methods and results. Besides the claim of utility for a technique or application, I want to understand how the paper supports its claim of improving users’ understanding of the data. So I put together this guide to the papers that ran experiments comparatively measuring user performance.
1. Common Angle Plots as Perception-True Visualizations of Categorical Associations – Heike Hofmann, Marie Vendettuoli – PDF
Tuesday 12:10 pm
2. What Makes a Visualization Memorable? – Michelle A. Borkin, Azalea A. Vo, Zoya Bylinskii, Phillip Isola, Shashank Sunkavalli, Aude Oliva, Hanspeter Pfister – PDF
Tuesday 2:00 pm
3. Perception of Average Value in Multiclass Scatterplots – Michael Gleicher, Michael Correll, Christine Nothelfer, Steven Franconeri – PDF
Tuesday 2:20 pm
4. Interactive Visualizations on Large and Small Displays: The Interrelation of Display Size, Information Space, and Scale – Mikkel R. Jakobsen, Kasper Hornbaek – PDF
Tuesday 3:00 pm
5. A Deeper Understanding of Sequence in Narrative Visualization – Jessica Hullman, Steven Drucker, Nathalie Henry Riche, Bongshin Lee, Danyel Fisher, Eytan Adar – PDF
Wednesday 8:30 am
6. Visualizing Request-Flow Comparison to Aid Performance Diagnosis in Distributed Systems – Raja R. Sambasivan, Ilari Shafer, Michelle L. Mazurek, Gregory R. Ganger – PDF
Wednesday 10:50 am
7. Evaluation of Filesystem Provenance Visualization Tools – Michelle A. Borkin, Chelsea S. Yeh, Madelaine Boyd, Peter Macko, Krzysztof Z. Gajos, Margo Seltzer, Hanspeter Pfister – PDF
Wednesday 11:10 am
8. DiffAni: Visualizing Dynamic Graphs with a Hybrid of Difference Maps and Animation – Sébastien Rufiange, Michael J. McGuffin – PDF
Thursday 2:00 pm
9. Edge Compression Techniques for Visualization of Dense Directed Graphs – Tim Dwyer, Nathalie Henry Riche, Kim Marriott, Christopher Mears – PDF
Thursday 3:20 pm
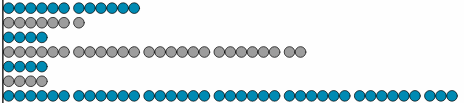
Less than a quarter
Only 9 out of 38 InfoVis papers (24%) this year comparatively measured user performance. While that number has improved and doesn’t need to be 100%, less than a quarter just seems low.
Possible reasons why more papers don’t evaluate user performance
- Limited understanding of experiment design and statistical analysis. How many people doing vis research are familiar with different experiment designs like method of adjustment or forced-choice? How many have run a t-test or a regression?
- Evaluation takes time. A paper that doesn’t evaluate user performance can easily scoop a similar paper with a thorough evaluation.
- Evaluation takes space. Can a novel technique and an evaluation be effectively presented within 10 pages? Making better use of supplemental material may solve this problem.
- Risk of a null result. It’s hard – if possible at all – to truly “fail” in a technique or application submission. But experiments may reveal no statistically significant benefit.
- The belief that the benefit of a vis is obvious. We generally have poor awareness of our own attentional limitations, so it’s actually not always clear what about a visualization doesn’t work. Besides being poor at assessing our abilities, it’s also important to know for which tasks a novel visualization is better than traditional methods (e.g. excel and sql queries) vs. when the traditional methods are better.
- A poisoned well. If a technique or application has already been published without evaluation, reviewers would scoff at an evaluation that merely confirms what was already assumed. So an evaluation of past work would only be publishable if it contradicts the unevaluated assumptions. It’s risky to put the time into a study if positive results may not be publishable.
I’m curious to hear other people’s thoughts on the issue. Why don’t more papers have user performance evaluations? Should they?
P.S. Check out this paper looking at evaluation in SciVis.

")