It’s that time of year again. InfoVis abstracts have been submitted, and lots of people are scrambling to finish their full submission.
I was curious about the distribution of keywords in the submissions, so I visualized some of the data available to the program committee (PC). After checking with the chairs, I thought others might be curious about the results.
Note that these are only abstracts, so there will probably be some attrition before the full paper submission deadline. To see a MUCH more thorough analysis of multiple years and venues, check out http://keyvis.org
Following the rules
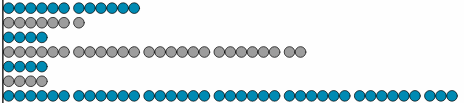
The instructions state that submissions may use up to 4 keywords. Ha! That limit seems to be completely ignored by a third of submissions. Having lots of keywords makes it very confusing and difficult for the chairs and PCs to determine a proper fit. It also really shows a lack of focus.

And the winner is…
The most common keyword is “Quantitative Evaluation” with 42 submissions. Although I’m optimistic that quantitative studies are a plurality, those submission make up less than 18% of the 239 abstracts. However, it’s not clear how to interpret that number because I’ve spotted a few abstracts that have a performance evaluation but aren’t labelled accordingly.
A question worth asking is whether there are enough PC members who are experts in quantitative experiment design to review all of these submissions. If the number of submissions with quantitative experiments increased, could we ensure that every one of them gets a PC member who has taken at least one course entirely devoted to experimental methods?

Per Robert Kosara‘s suggestion, I sorted by count. The use of keywords follows an impressively smooth power law:

Co-occurrences
Perhaps it’s not surprising, but quantitative evaluation and qualitative evaluation appear together farm more often than other keyword pairs. Here are the top co-occurring pairs:
| keyword1 | keyword2 | count |
|---|---|---|
| QuanEval | QualEval | 13 |
| QuanEval | VisuaDes | 10 |
| InterDes | hci | 9 |
| Geo | Graph | 9 |
| QuanEval | Laborat | 8 |
| hci | ui | 8 |
| Masses | Dissem | 8 |
| ui | InterDes | 8 |
Per Enrico’s question, here’s a small multiple list of the top five pairs for each keyword. I posted a top 10 resorted table here.

I’m not a fan of these visualizations, but here’s an adjacency matrix with all of the pairings.
Other questions
Down the line, I’m curious how the attrition rate between abstract and full paper will vary by keyword. Also, I’d be happy to repeat this for SciVis or VAST if any PCs or chairs want a similar breakdown. Just let me know.