Invalid Conclusions Built on Statistical Errors

When you see p = 0.003 or a 95% confidence interval of [80, 90], you might assume a certain clarity and definitiveness. A null effect is very unlikely to yield those results, right?

But be careful! Such overly simple reporting of p-values, confidence intervals, Bayes factors, or any statistical estimate could hide critical conclusion-flipping errors in the underlying methods and analyses. And particularly in applied fields, like visualization and Human-Computer Interaction (HCI), these conclusion-flipping errors may not only be common, but they may explain the majority of study results.

Here are some example scenarios where reported results may seem clear, but hidden statistical errors categorically change the conclusions. Importantly, these scenarios are not obscure, as I have found variants of these example problems in multiple papers.

Continue reading

More precise measures increase standardized effect sizes

My last post – Simulating how replicate trial count impacts Cohen’s d effect size – focused mostly on how parameters of within-subjects experiments impact effect size. Here, I’ll clarify how measurement precision in between-subjects experiments can substantially influence standardized effect sizes.

More replicate trials = better precision

A precise measurement is always an aim of an experiment, although practical and budgetary limitations often get in the way. Attentive subjects, carefully calibrated equipment, and a well controlled environment can all improve measurement precision. Averaging together many replicate trials is another approach for improving precision, and it can also be easily simulated.

Continue reading

Simulating how replicate trial count impacts Cohen’s d effect size

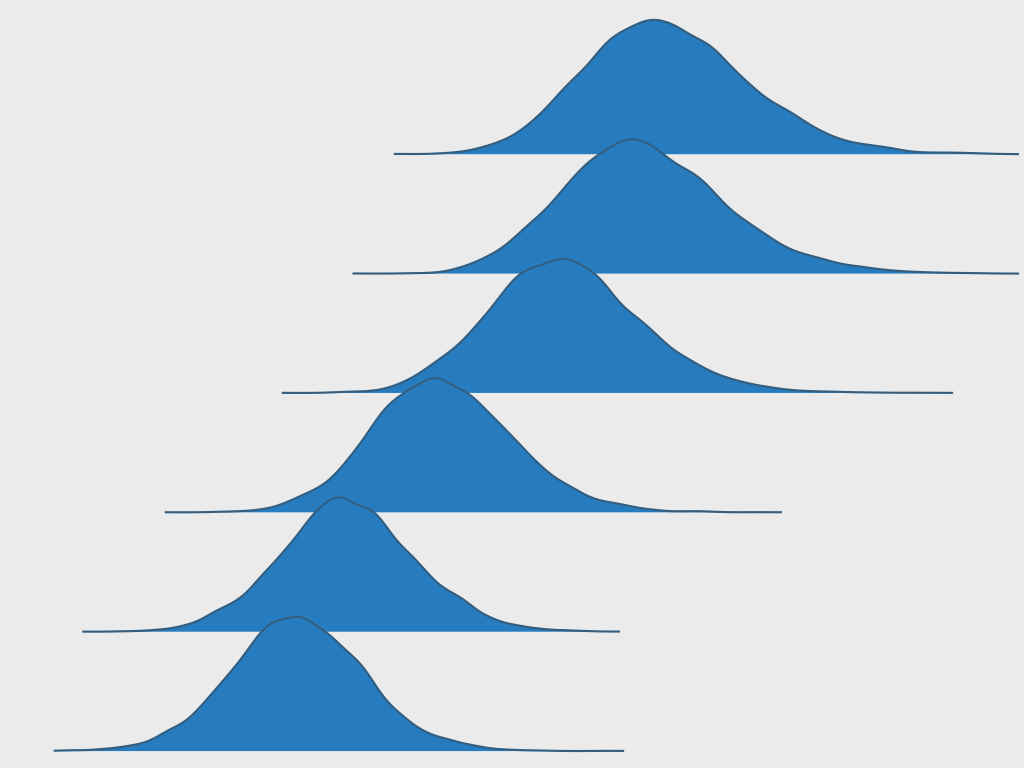
Imagine reading two different abstracts. Both study the same effect. Both use the same methods and stimuli. Both have the same high subject count (N). One reports an effect size of d = 0.1 [-0.2, 0.4] (p = 0.3). The other reports an effect size of d = 3.0 [2.0, 4.0] (p = 0.0003).

These vastly different outcomes could easily occur due to differing experiment and analysis approaches that almost never appear in the abstract. No statistical fluke needed. In fact, direct replications would likely yield very similar results.

Studies are often complimented and criticized based on the sample size (N) and standardized effect size (Cohen’s d). “That N is too small for me to trust the results“. “That Cohen’s d is impossibly large“. But when there are within-subject designs or replicate trials, N and Cohen’s d don’t reliably inform about statistical power or reliability. The simple parameters that often appear in abstracts are so vague and uninterpretable that any heuristic based on them is necessarily flawed.

Subject count is only one dimension of sample size

Continue reading
DALL-E generated: A series of hurdles with data at the end

Scrutiny for thee but not for me: When open science research isn’t open

A fundamental property of scientific research is that it is scrutinizable. And facilitating that scrutiny by eliminating barriers that delay or prevent access to research data and replication materials is the major goal for transparent research advocates. So when a paper that actually studies open research practices hides its data, it should raise eyebrows. A recent paper about openness and transparency in Human-Computer Interaction did exactly that.

The paper is titled “Changes in Research Ethics, Openness, and Transparency in Empirical Studies between CHI 2017 and CHI 2022“. It looked at various open practices of papers sampled from the ACM CHI proceedings in 2017 and 2022. Then it compared how practices like open data, open experiment materials, and open access changed between those years. Sounds like a substantial effort that’s potentially very useful to the field! But it doesn’t live up to the very standards it’s researching and advocating for.

Continue reading
Building Facades. Credit: Zacharie Gaudrillot-Roy

Why open data is critical during review: An example

While reviewing a paper a while ago, a single word in the methods section caught my eye: “randomized“. Based on that single word, I strongly suspected that the methods were not accurately reported and that the conclusions were entirely unsupported. But I also knew that I’d never be able to prove it without the data. Here, I’ll explain what happened in this one example of why empirical papers without open data (or an explicit reason why the data can’t be shared) hamper review and shouldn’t be trusted.

Starting the review

I got a review request for a paper that had been through a couple rounds of review already, but the previous reviewers were unavailable for the revision. I don’t mind these requests, as the previous rounds of review should have caught glaring problems or clarity issues. As I always do, I skimmed the abstract and gave the paper a quick glance to make sure I was qualified. Then I accepted.

While some people review a paper by reading it in order, and others start with the figures, I jump straight to the methods. The abstract and title made the paper’s goals clear, so I had a good gist of the core question. Since I tend to prioritize construct validity in my reviews, I wanted to know whether the experiment and analysis actually provide sufficient evidence to answer the question posed.

The methods

The experiment showed 4 different items, and the task was to select one based on the instruction’s criteria. Over 200 subjects were run. There’s no need to go into more specifics. It was a single-trial 4-alternative-forced-choice (4AFC) experiment that also had an attention check. The items were shown in a vertical column, and the paper noted that the order of the items was “randomized” and that an equal number of subjects were presented with each ordering. The goal was to figure out which item was more likely to be selected.

Did you spot what caught my attention?

Continue reading

How a polite reviewing system behaves

Reviewing can be a major time-expenditure, and it’s done by volunteers. So it is especially audacious that many reviewing systems seem to avoid basic usability courtesies that would make the process less obnoxious.

What would a polite reviewing system look like? How would it behave towards reviewers? This is my proposal. 

The email request

The request needs to get a lot of info across, so potential reviewers can assess if they are qualified and willing to make the time commitment. Don’t bog it down with a bunch of unnecessary crap. Avoid talking about your “premier journal”, its “high standards”, and any other bullshit loftiness. Get to the point.

Here is a review request template. Notice that the information is clearly organized. Besides the obvious details, it includes: Continue reading

A bare minimum for open empirical data

It should be possible for someone to load and analyze your data without ever speaking to you and without becoming enraged in frustration.

Open

It needs to actually be shared publicly. None if this “available upon request” nonsense. There’s no excuse for hiding the data that supports an article’s claims. If the data is not shared, you’re inviting people to assume the you fabricated the results.

What about privacy? Collecting sensitive data doesn’t in any way diminish the likelihood of a calculation error or the incentive to falsify results. For identifiable or sensitive data, put it in a protected access repository

Where to post it? 

Continue reading

Reviewing Tip: The 10-Minute Data Check

Solving a Rubik’s Cube takes skill and time. But checking if at least one face is solved correctly is quick and simple. Science should work the same way.

While it’d be ideal to be able to perform a full computational reproducibility check to detect errors in all submitted manuscripts, journals rarely allocate resources towards it. There are some notable exceptions like Meta-Psychology that have a designated editor rerun the analyses once a manuscript has passed review. The readers, in turn, can be confident that the reported results accurately represent the data. However, most journals do not have such a resource. And reviewers and editors rarely have the time to add an entire reproducibility check to their often overburdened reviewing load.

But even without a full reproducibility check, reviewers can still do quick checks for egregious errors. So here are some quick checks a reviewer can do without a major time commitment.

Note: These checks may seem overly simple, but I’ve spotted each of these issues in at least one submission. And about 1 in 4 submissions I review sadly fail one of these tests.

The Checks 

Continue reading

Squid Game. People with guns overlooking players

The unenumerated rights of reviewers

Imagine you’re reviewing a submission. It has an experiment comparing how quickly subjects can get a correct answer using one of two visualization techniques. When measuring speed, it’s important to keep accuracy high. So whenever a subject would get an incorrect answer, the researchers would hammer a sharpened piece of bamboo under the subject’s fingernail. The results made strong advancements to our understanding of how people can extract information from charts. How would you respond to this submission as a reviewer?

Ethical compensation

Earlier today, I was on a panel that discussed ethical payment for study participants. Towards the end, the topic came up about what would happen if a reviewer comments that payment is unacceptably low. One panelist noted that that when IEEE VIS reviewers have raised ethical concerns about a submission poorly paying participants, the chairs dismissed those concerns because there is no explicitly stated rule about subject payment. (Edit: the panelist clarified that this was for a different ethical concert. But the premise still holds.) In fact, there is no rule in the IEEE VIS submission guidelines about human-subjects ethics at all. Continue reading

Open Access VIS 2019 – Part 3 – Who’s Who

This is part 3 of a multi-part post summarizing open practices in visualization research for 2019, as displayed on Open Access Vis. Research openness can either rely on policy or individual behavior. In this part, I’ll look at the individuals. Who in the visualization community is consistently sharing the most research? And who is not?

Related posts: 2017 overview, 2018 overview, 2019 part 1 – Updates and Papers, 2019 part 2 – Research Practices

Whose papers are open?

Many authors are sharing most or even all of their papers on open repositories, which is fantastic progress. But many are not, despite encouragement after acceptance. Easier options, better training, and formal policies will likely be necessary for a field-wide change in behavior. Continue reading