The goal of my research is to bridge the gap between computer science
and psychology. This work falls into the computer science areas of HCI
(human-computer interaction) and Visualization as well as the psychology
and neuroscience areas of perception and attention.
 News media often use stacks of little icons to represent a value in a chart. These "ISOTYPE visualizations" are supposedly more appealing and engaging. But are they perceived more accurately or rememebred better? If so, why?
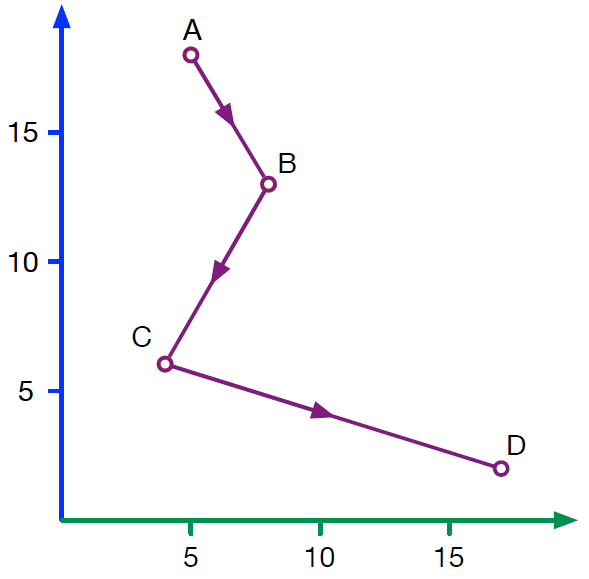 How can you engagingly present a pair of time series? Journalists have recently revitalized an old graph type, called a "Connected Scatterplot", as they assume it is effective and engaging. We ran a collection of experiments to test these assumptions.
 How do capacity limits of attention impact visualization effectiveness? What
roles do user-goals and design descisions play in those limits? How do
visual features such as color and motion differ? This
study seeks to answer these fundamental questions about visualization.
How do capacity limits of attention impact visualization effectiveness? What
roles do user-goals and design descisions play in those limits? How do
visual features such as color and motion differ? This
study seeks to answer these fundamental questions about visualization.
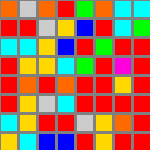
 When
we perceive a crowd of people, must our visual system serially
examine each person, or can we rapidly percieve the summary or gist?
What, if any, side effects might result from a encoding a crowd as an
individual percept?
When
we perceive a crowd of people, must our visual system serially
examine each person, or can we rapidly percieve the summary or gist?
What, if any, side effects might result from a encoding a crowd as an
individual percept?
 The visual system is built to most
efficiently represent natural stimuli, which are noted to have
power spectra that follow a f-2 trend. Since visualizations attempt to
provide insight by sending data through the visual system, we tested
visualization screenshots to test their power spectra. By
running the results of the IEEE InfoVis contest through some image
analysis, we found that the winners of the competition tend to have
similar properties to the visual system.
The visual system is built to most
efficiently represent natural stimuli, which are noted to have
power spectra that follow a f-2 trend. Since visualizations attempt to
provide insight by sending data through the visual system, we tested
visualization screenshots to test their power spectra. By
running the results of the IEEE InfoVis contest through some image
analysis, we found that the winners of the competition tend to have
similar properties to the visual system.
 For
this project, we aimed to create an application that could
visualize millions of simulated cosmological particles and show how each
varied across time and simulation run. The resulting application uses
custom controls, infovis views, scivis views, and graphics hardware to
give users multiple, real-time, interactive perspectives of the
differences between particles.
For
this project, we aimed to create an application that could
visualize millions of simulated cosmological particles and show how each
varied across time and simulation run. The resulting application uses
custom controls, infovis views, scivis views, and graphics hardware to
give users multiple, real-time, interactive perspectives of the
differences between particles.
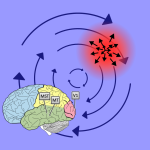 What
are the limits of our perception of optic flow? How does it impact our
ability to detect a features in fields of motion? We investigated these
questions and explored the use of this visual feature in visualization.
What
are the limits of our perception of optic flow? How does it impact our
ability to detect a features in fields of motion? We investigated these
questions and explored the use of this visual feature in visualization.
The poster was presented at APGV 2010.
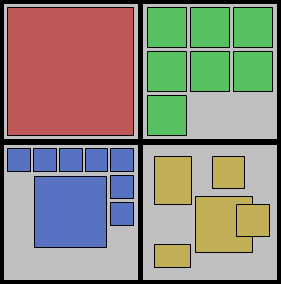 In
this user study, we analyzed layout schemes of multiple views. The goal
was to determine whether different arrangements were beneficial in
understanding time-varying volume visualizations. We
conducted a user study of four layout techniques for multiple views. Participants
were timed as they separated different
aspects of volume data for both time-invariant and time-variant data
using one of four different layout schemes. For
time-variant data, the multiple view layouts all resulted in
better times than did the single view. Surprisingly, different layout
techniques for multiple views resulted in no noticeable difference in
user performance.
In
this user study, we analyzed layout schemes of multiple views. The goal
was to determine whether different arrangements were beneficial in
understanding time-varying volume visualizations. We
conducted a user study of four layout techniques for multiple views. Participants
were timed as they separated different
aspects of volume data for both time-invariant and time-variant data
using one of four different layout schemes. For
time-variant data, the multiple view layouts all resulted in
better times than did the single view. Surprisingly, different layout
techniques for multiple views resulted in no noticeable difference in
user performance.