Overview
The visual system most efficiently represents natural stimuli, which are noted to have power spectra that follow an f-2 trend. Since visualizations attempt to provide insight by sending data through the visual system, we tested visualization screenshots to see if they share properties with natural images. By running the results of the IEEE InfoVis contest through some image analysis, we found that the winners of the competition tend to be more natural.
Publications
Steve Haroz, Kwan-Liu Ma, "Natural Visualizations," EuroVis 2006, pp. 43-50 (pdf)
Spatial Frequencies
 Spatial frequencies are similar to sound
frequencies. Sound frequencies are a measurement of compression
varied over time, whereas spatial frequencies are a measurement of
intensity varied over distance. Since spatial frequencies can only
measure a single intensity value, brightness is commonly
used.
Spatial frequencies are similar to sound
frequencies. Sound frequencies are a measurement of compression
varied over time, whereas spatial frequencies are a measurement of
intensity varied over distance. Since spatial frequencies can only
measure a single intensity value, brightness is commonly
used.
One way to measure the spatial frequencies of a
function is by using Fourier transforms. Essentially, sine and
cosine waves of different amplitude and frequency are added together
to form the intended function. These sine and cosine functions make
up a Fourier series. For a two dimensional image, the Fourier
transforms are performed over each line in the horizontal axis then
over each line in the vertical axis or vice versa. In turn, to find
the two-dimensional Fourier transform of an n-by-n image, one must
find 2n one-dimensional Fourier transforms.
Natural and Unnatural Images
 A natural image is any picture of nature. Pictures
of a forest scene, a mountain, or a dog would be considered natural
images. This class of images constitutes an infinitely small fraction of
all possible images, yet our visual system is precisely tuned to perceive
them rather than some larger range of image types. In fact, recent studies
have shown that the eye actually regulates its growth to maintain a
natural image on the retina. To measure the spatial frequency distribution
of these images, one begins by computing the Fourier transform. The
rotational average of the two dimensional result yields a more manageable,
one dimensional series also known as a power spectrum. When the amplitude
of this spectrum is plotted on a log-log scale as a function of frequency,
the spatial frequency distribution can be visualized.
A natural image is any picture of nature. Pictures
of a forest scene, a mountain, or a dog would be considered natural
images. This class of images constitutes an infinitely small fraction of
all possible images, yet our visual system is precisely tuned to perceive
them rather than some larger range of image types. In fact, recent studies
have shown that the eye actually regulates its growth to maintain a
natural image on the retina. To measure the spatial frequency distribution
of these images, one begins by computing the Fourier transform. The
rotational average of the two dimensional result yields a more manageable,
one dimensional series also known as a power spectrum. When the amplitude
of this spectrum is plotted on a log-log scale as a function of frequency,
the spatial frequency distribution can be visualized.
 Plots
of the power spectra from the natural images are shown above.
These plots have nearly straight lines with slopes of approximately -2,
which corresponds to an f-2 trend. The consistency between the plots is
not trivial, as these images appear quite dissimilar. Unnatural images
have very different power spectra. The images to the left show three unnatural
images and their corresponding spatial frequency plots. The distinctness
of natural images becomes more evident in these plots, as the unnatural
images do not show the f-2 trend. These plots have been observed for
tens of thousands of images, and the f-2 trend consistently
differentiates natural images
Plots
of the power spectra from the natural images are shown above.
These plots have nearly straight lines with slopes of approximately -2,
which corresponds to an f-2 trend. The consistency between the plots is
not trivial, as these images appear quite dissimilar. Unnatural images
have very different power spectra. The images to the left show three unnatural
images and their corresponding spatial frequency plots. The distinctness
of natural images becomes more evident in these plots, as the unnatural
images do not show the f-2 trend. These plots have been observed for
tens of thousands of images, and the f-2 trend consistently
differentiates natural images
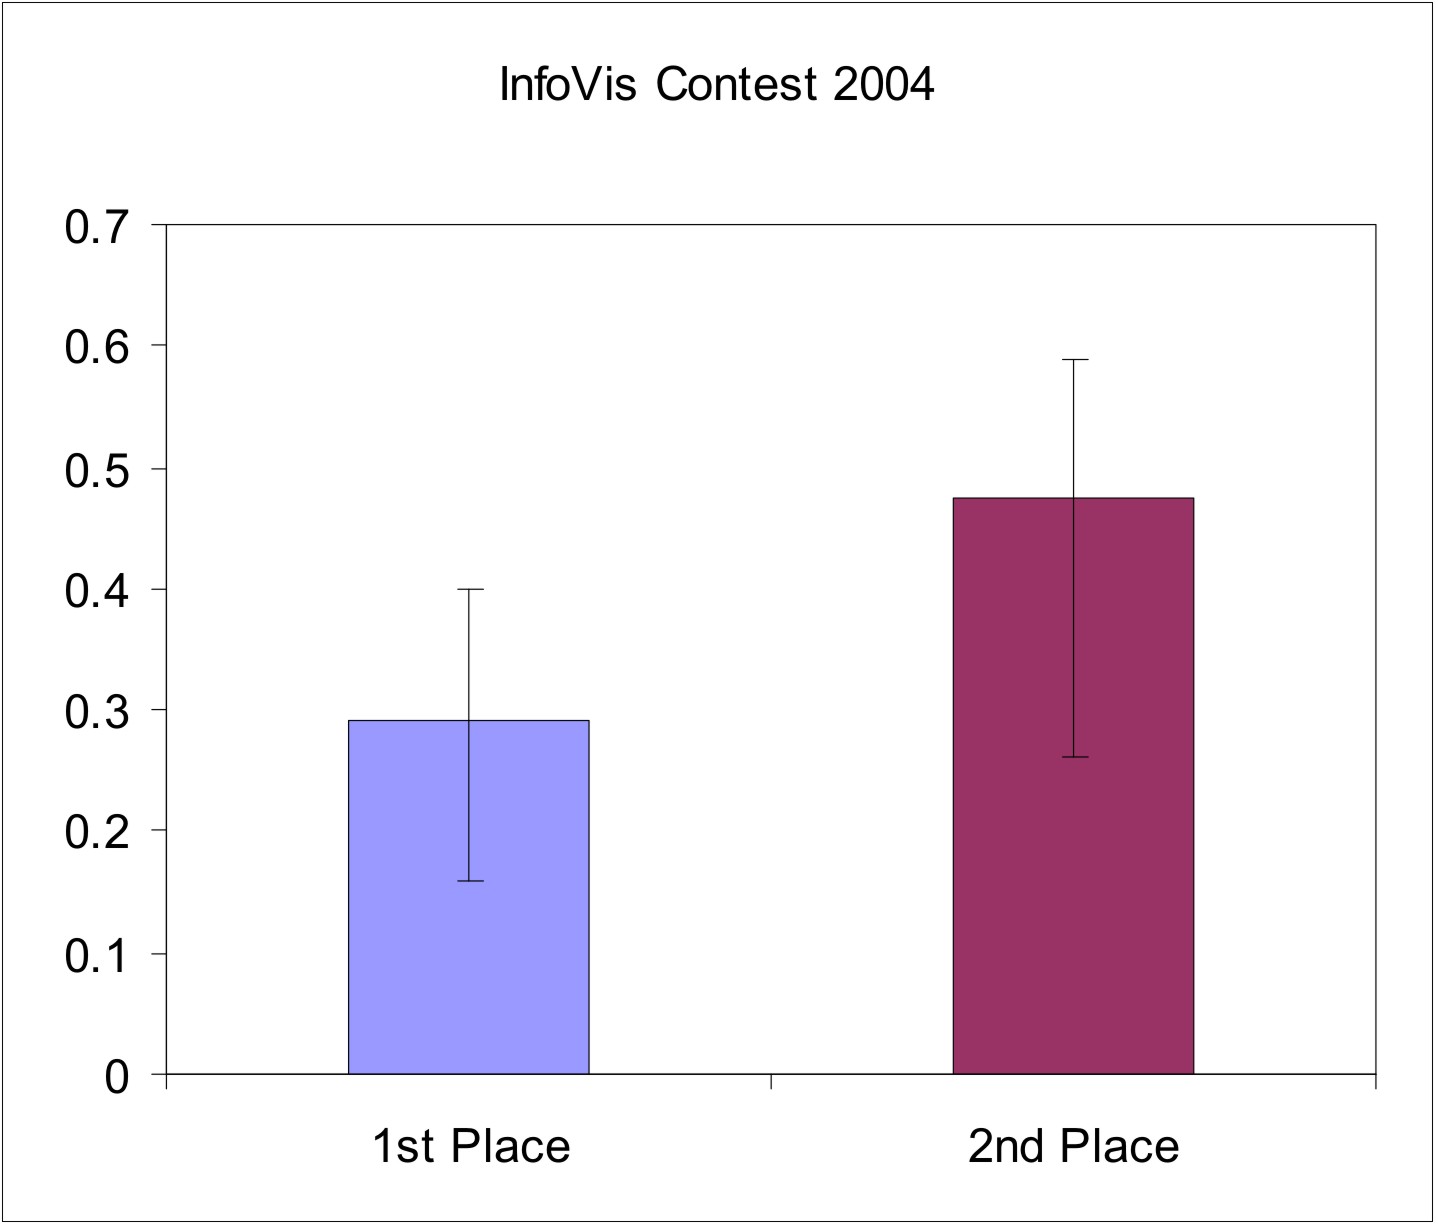
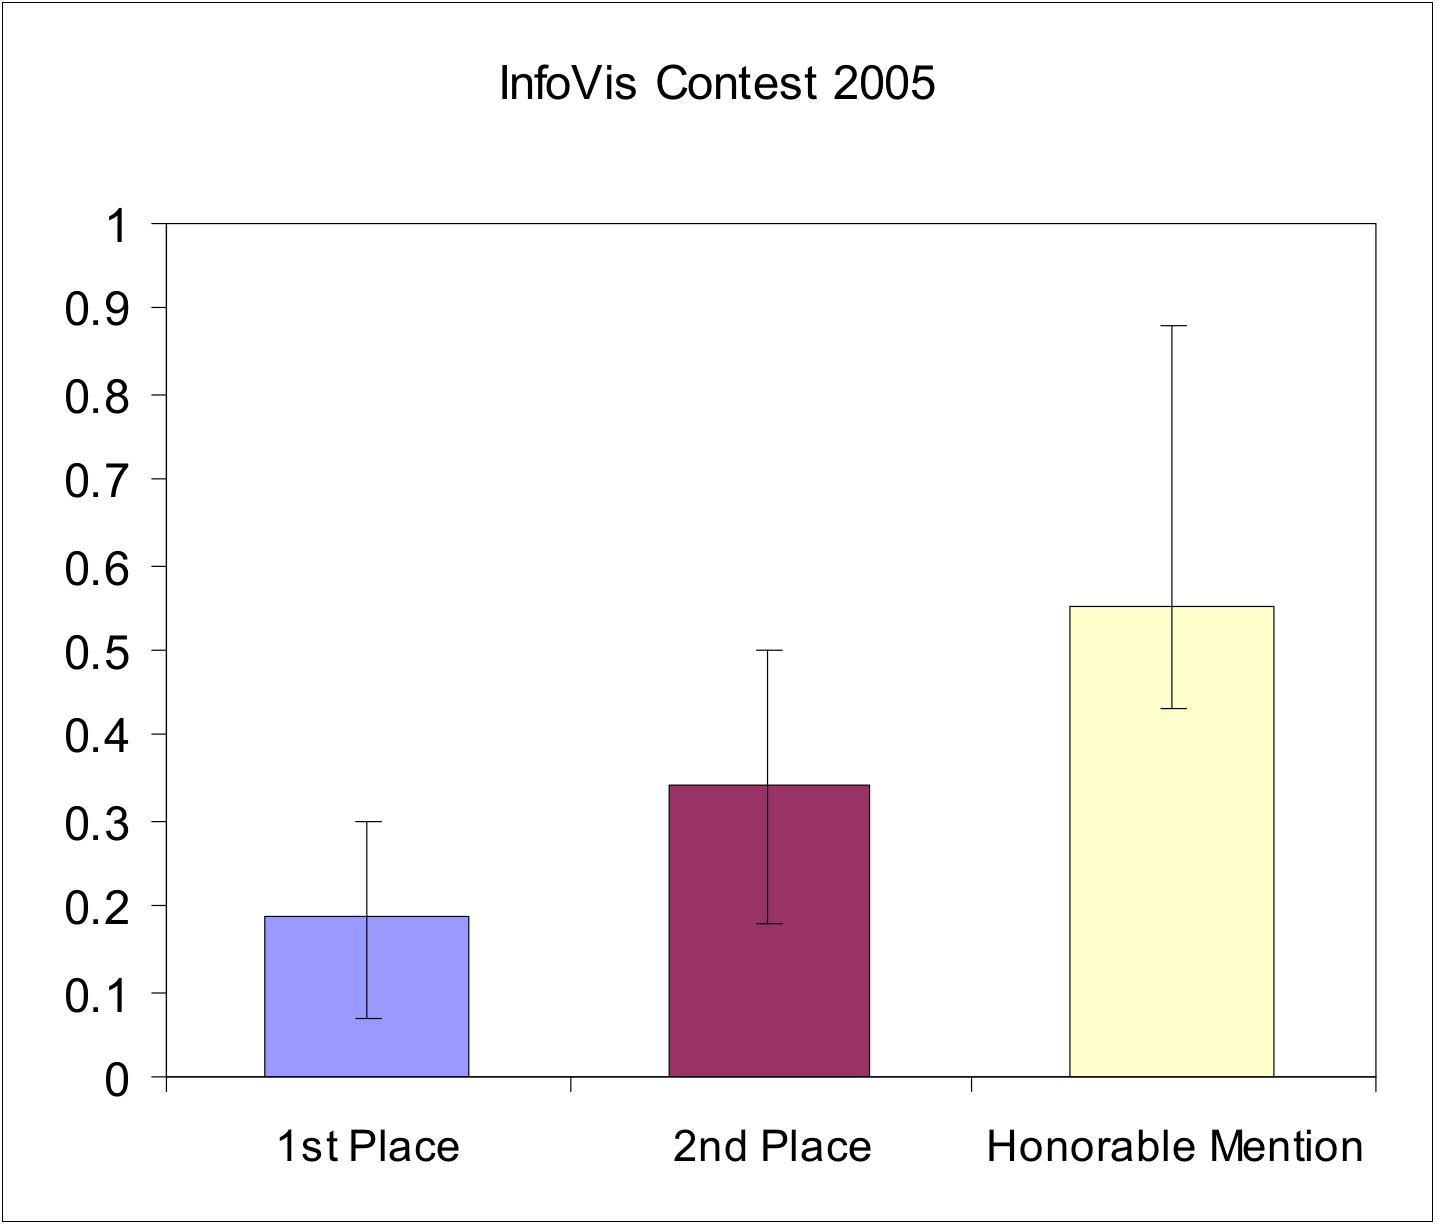
Testing Visualizations' Naturalness
To test if effective visualizations have
natural properties, we looked at the InfoVis contest
results. In the contests, a single dataset is used by all
participants to create a variety of visualizations. Judges then rank these
visualizations. We compared this rank with the visualizations'
naturalness. To measure the level of naturalness, we measured the distance
of the spatial frequency distribution from f-2. The results can be seen
below. Note that error bars represent entire value range, not
variance