Steve Haroz
Research Scientist
Cosmology
Collaborators:
Steve Haroz: Computer Science Department - UC Davis
Kwan-Liu Ma: Computer Science Department - UC Davis
Katrin Heitmann: Los Alamos National Laboratory
Publications
Steve Haroz, Katrin Heitmann, "Seeing the Difference between Cosmological Simulations," IEEE Computer Graphics and Applications, vol. 28, no. 5, pp. 37-45, Sep/Oct, 2008 (pdf)
Steve Haroz, Kwan-Liu Ma, Katrin Heitmann. Multiple Uncertainties in
Time-Variant Cosmological Particle Data. IEEE Pacific Visualization Symposium.
March, 2008, pp. 207-214 (pdf)
Purpose
The goal of this project was to visualize the differences between cosmology simulations.
Importantly, we wanted to create an application that could show this information interactively on consumer hardware.
The Simulations
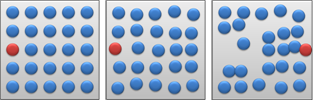
Each run of the the simulation has ~16.8 million (2563) particles. As the universe is made up of around 1070 particles, each simulation particle represents about 1063 actual particles, which is the size of galaxy cluster. The particles are initially arranged evenly on a 3D grid (see 1). They are then perturbed slightly to satisfy the cosmological initial conditions (see 2). The simulation then moves the particles based on gravitational forces forming dense clusters and sparse regions (see 3). Notice that the red particle moves so far left that it wraps around the edge.
The impact of the perturbations was the main focus of the study. The particle movements in the earliest epochs of the simulation are simply too small to be accurately represented by the simulator. Cosmologists thereby approximate the locations of the particles after some initial period, so they can effectively skip over the beginning of the simulation. The length of time that the approximation encompasses and the type of approximation used can vary by simulation. We therefore want to show how the approximations impact the results as the simulation progresses.
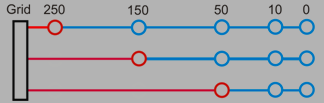
This figure illustrates the the different approximations. The approximation
estimated each particle's position and velocity at a certain timestep (the red
lines represent the approximations). The simulator then continued following the
gravitational forces of the particles, and it outputted the data at various
timesteps (the circles).
Results
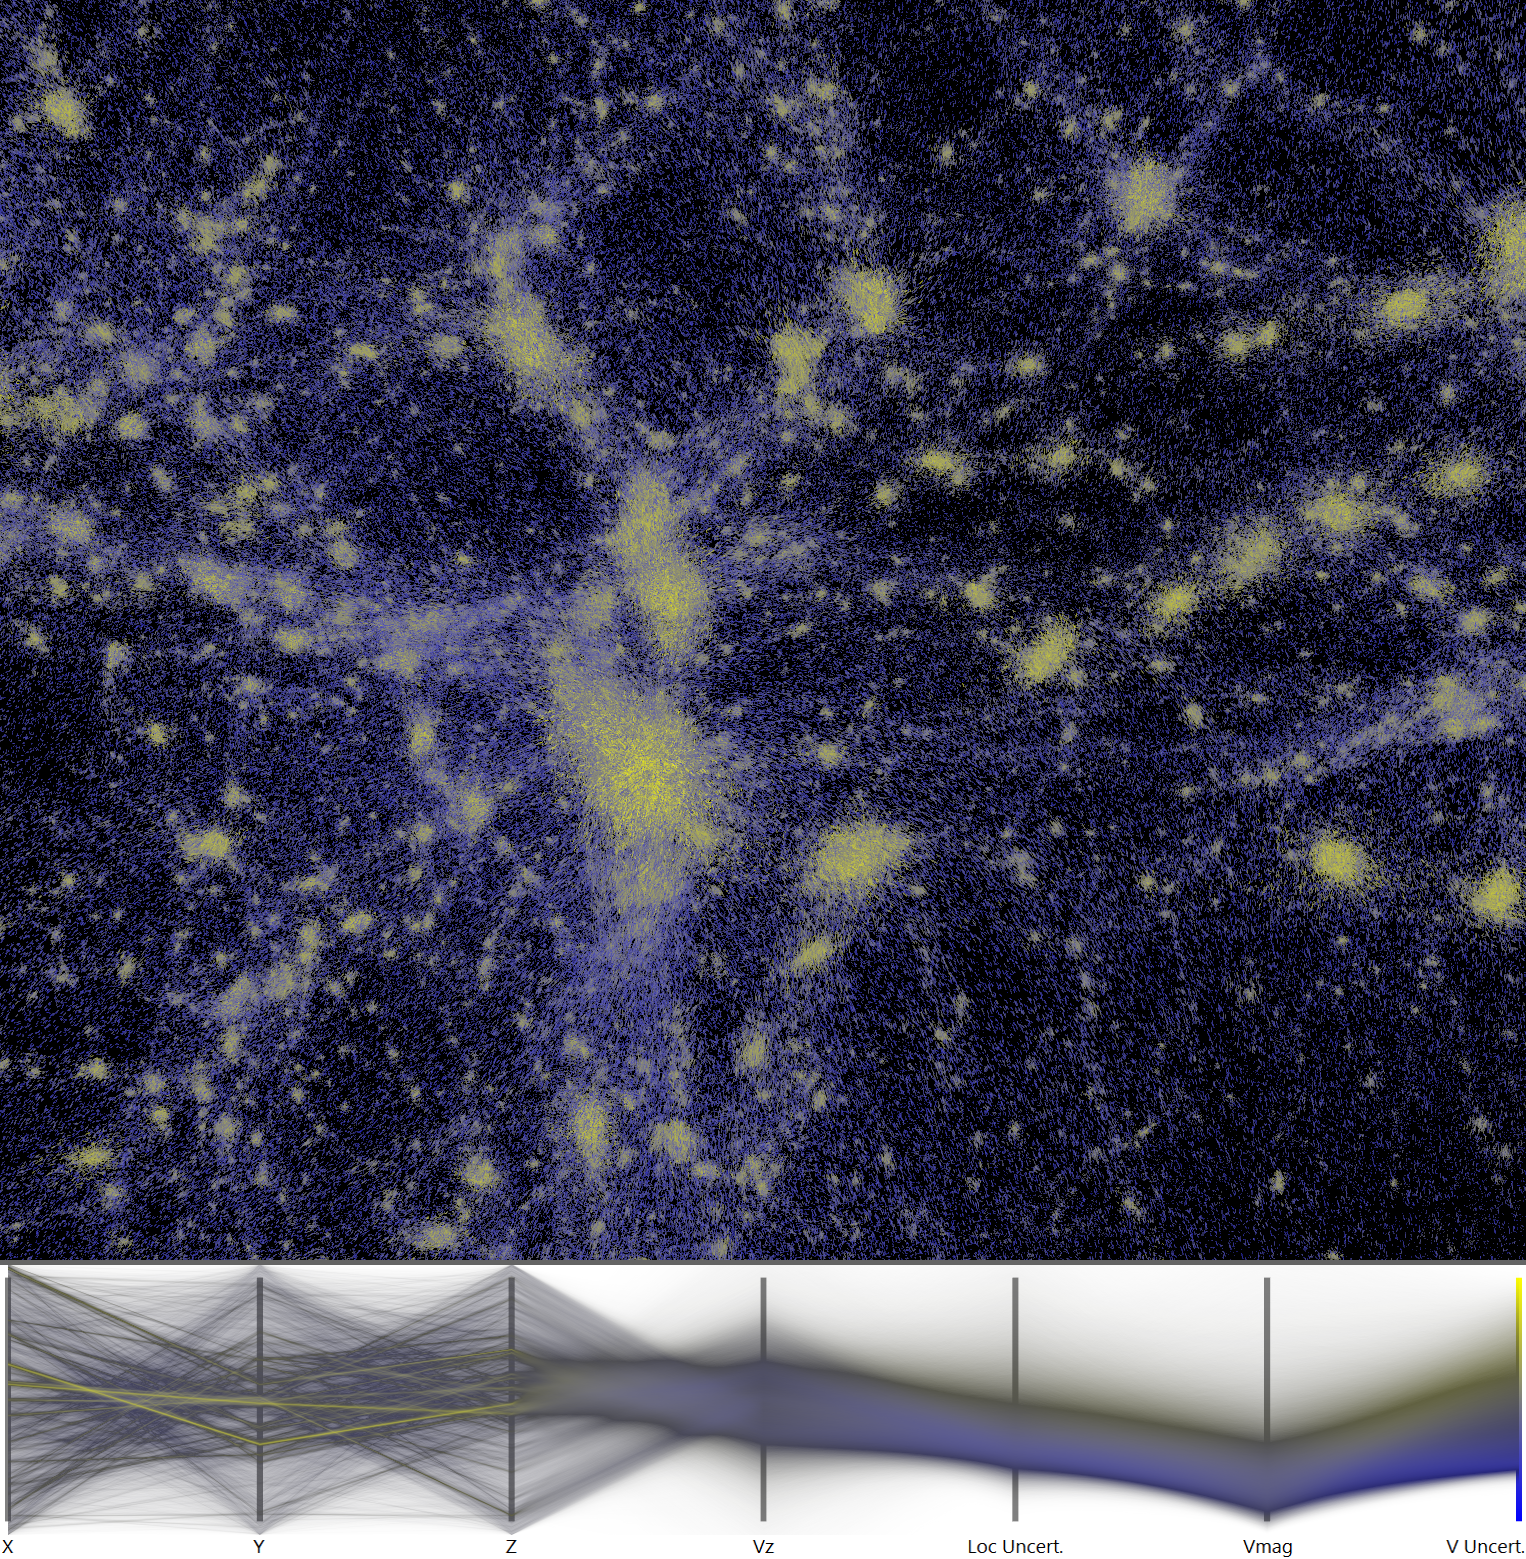
We initially examined how the simulation algorithms impacted the final results. The types of simplifications and estimations used by the simulators were found to effect the outcome. Variability of position and velocity were proportional to density and velocity. This example image compares simulations run using FLASH and HOT. Each particle is colored by the amount of difference (from dark blue to bright yellow). The dense clusters can be seen to have very high variation, whereas the sparse regions are fairly consistent.
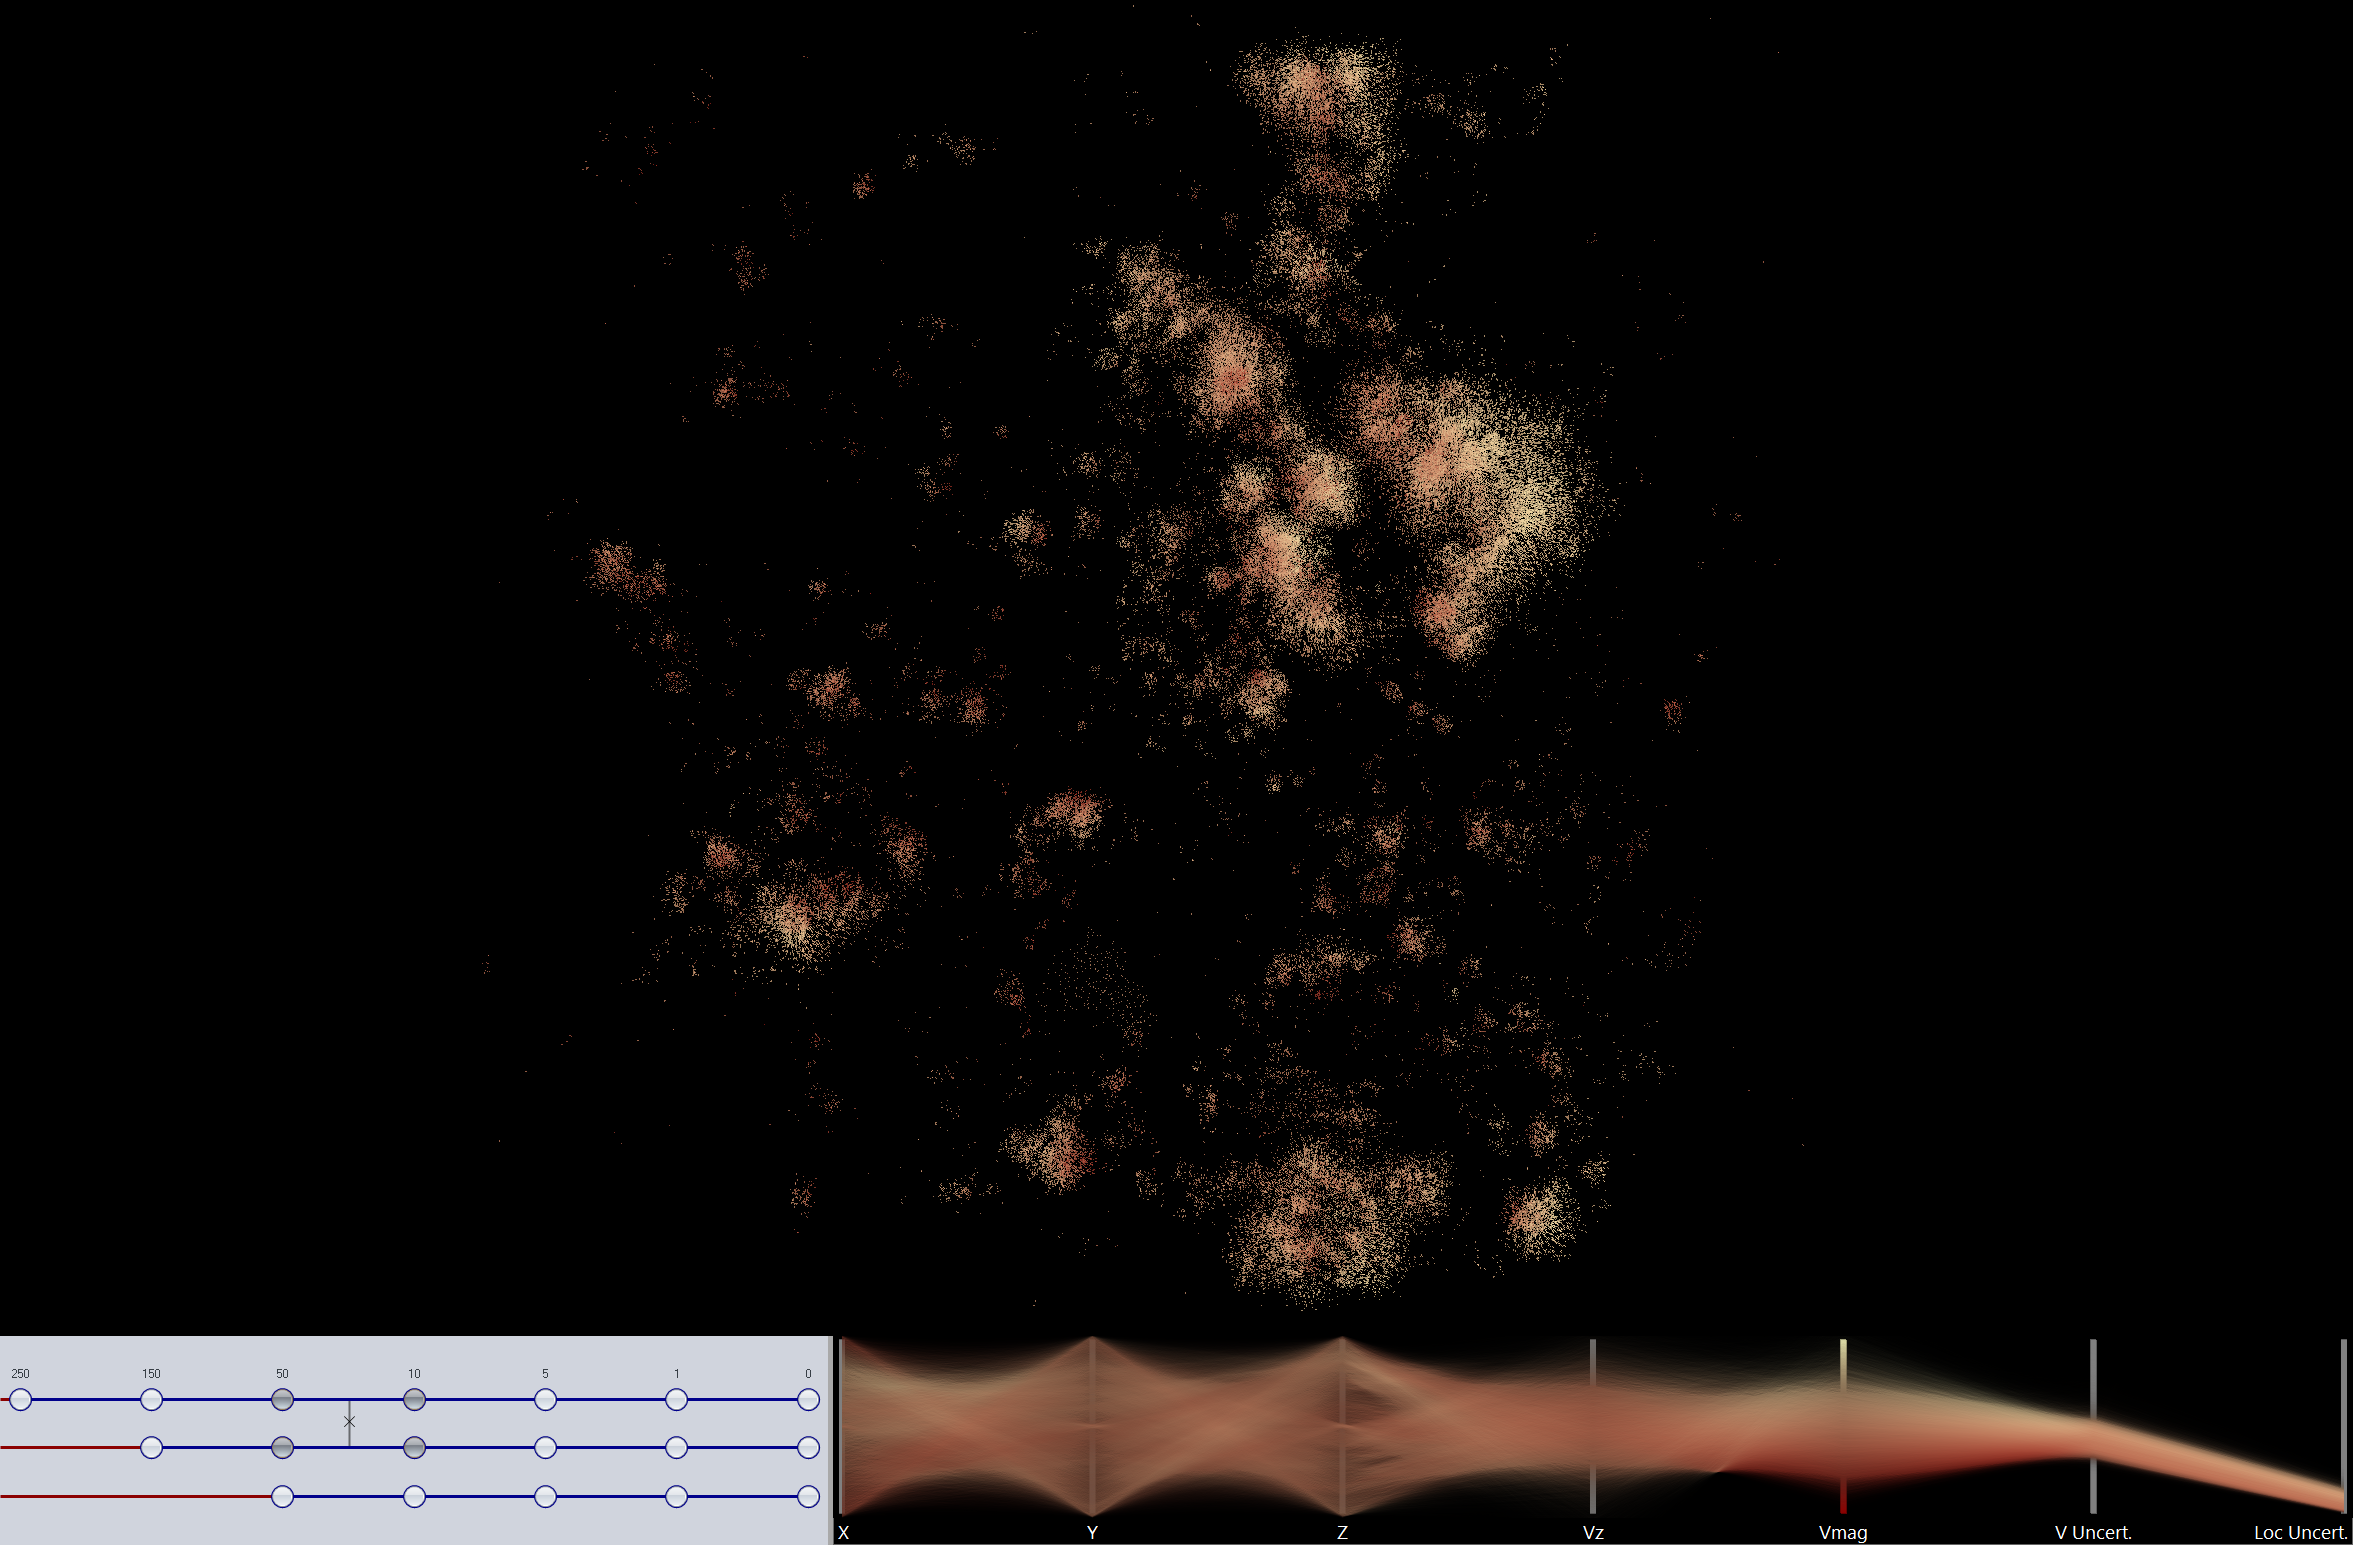
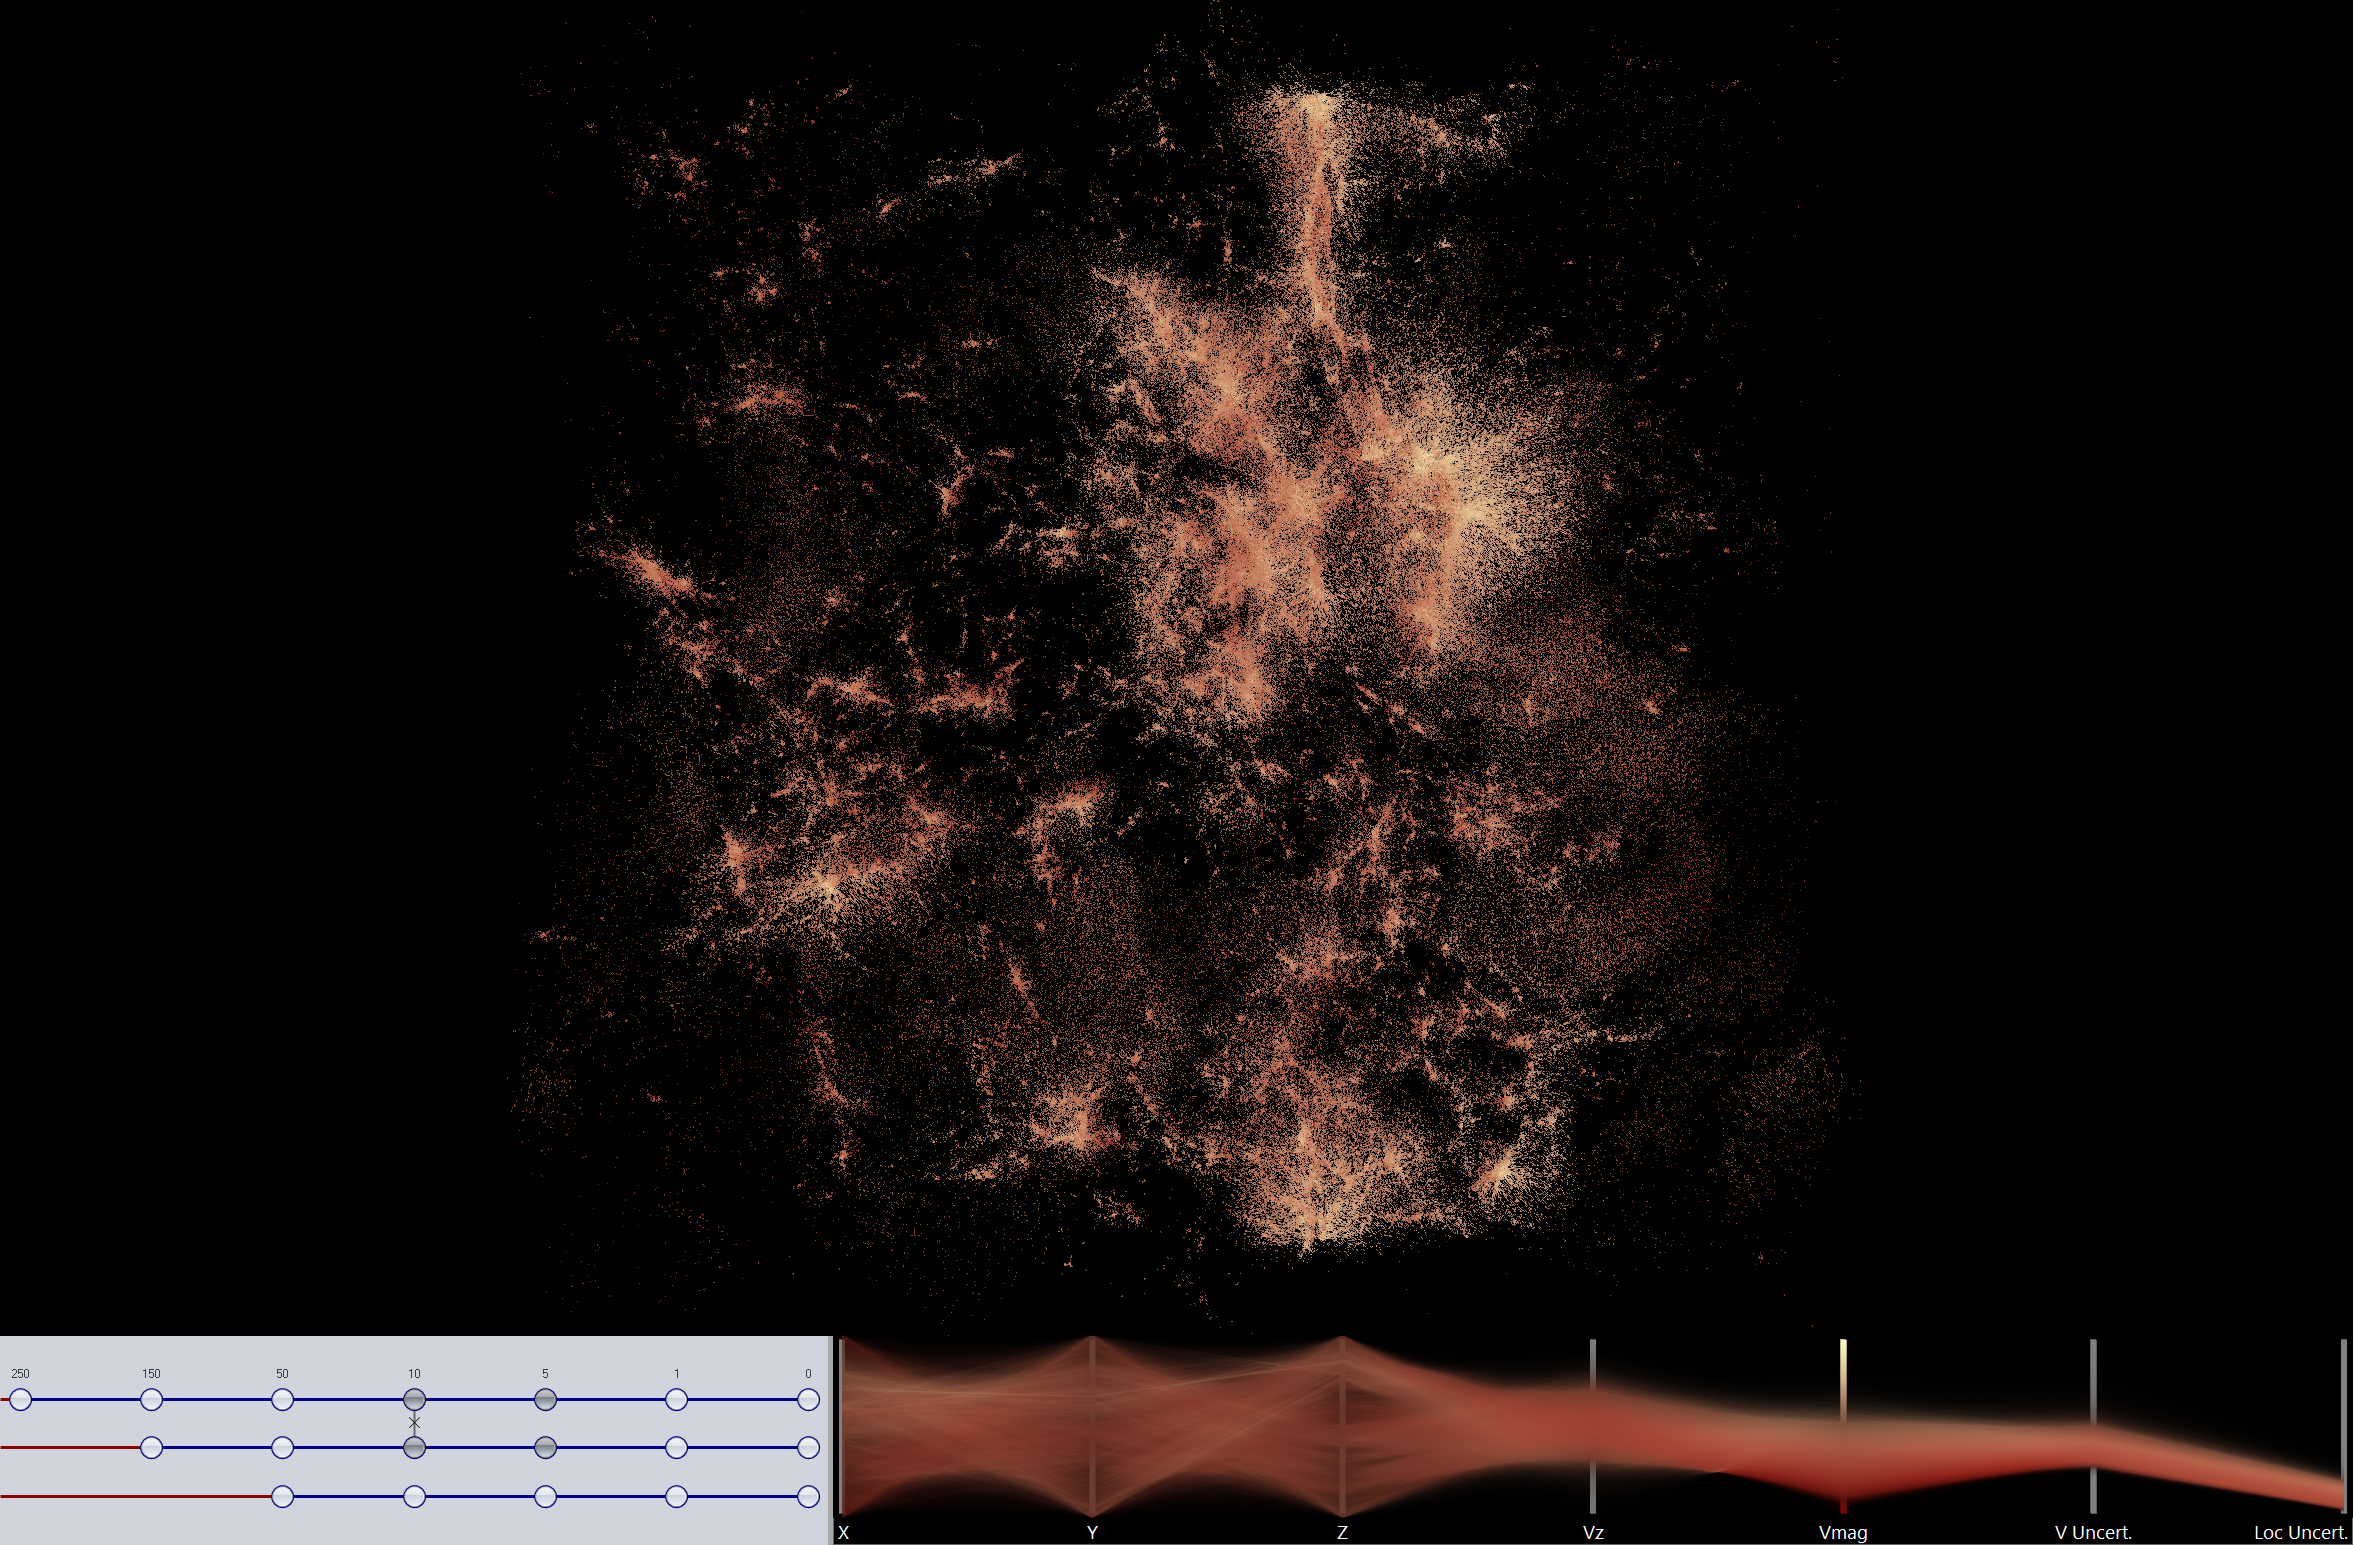
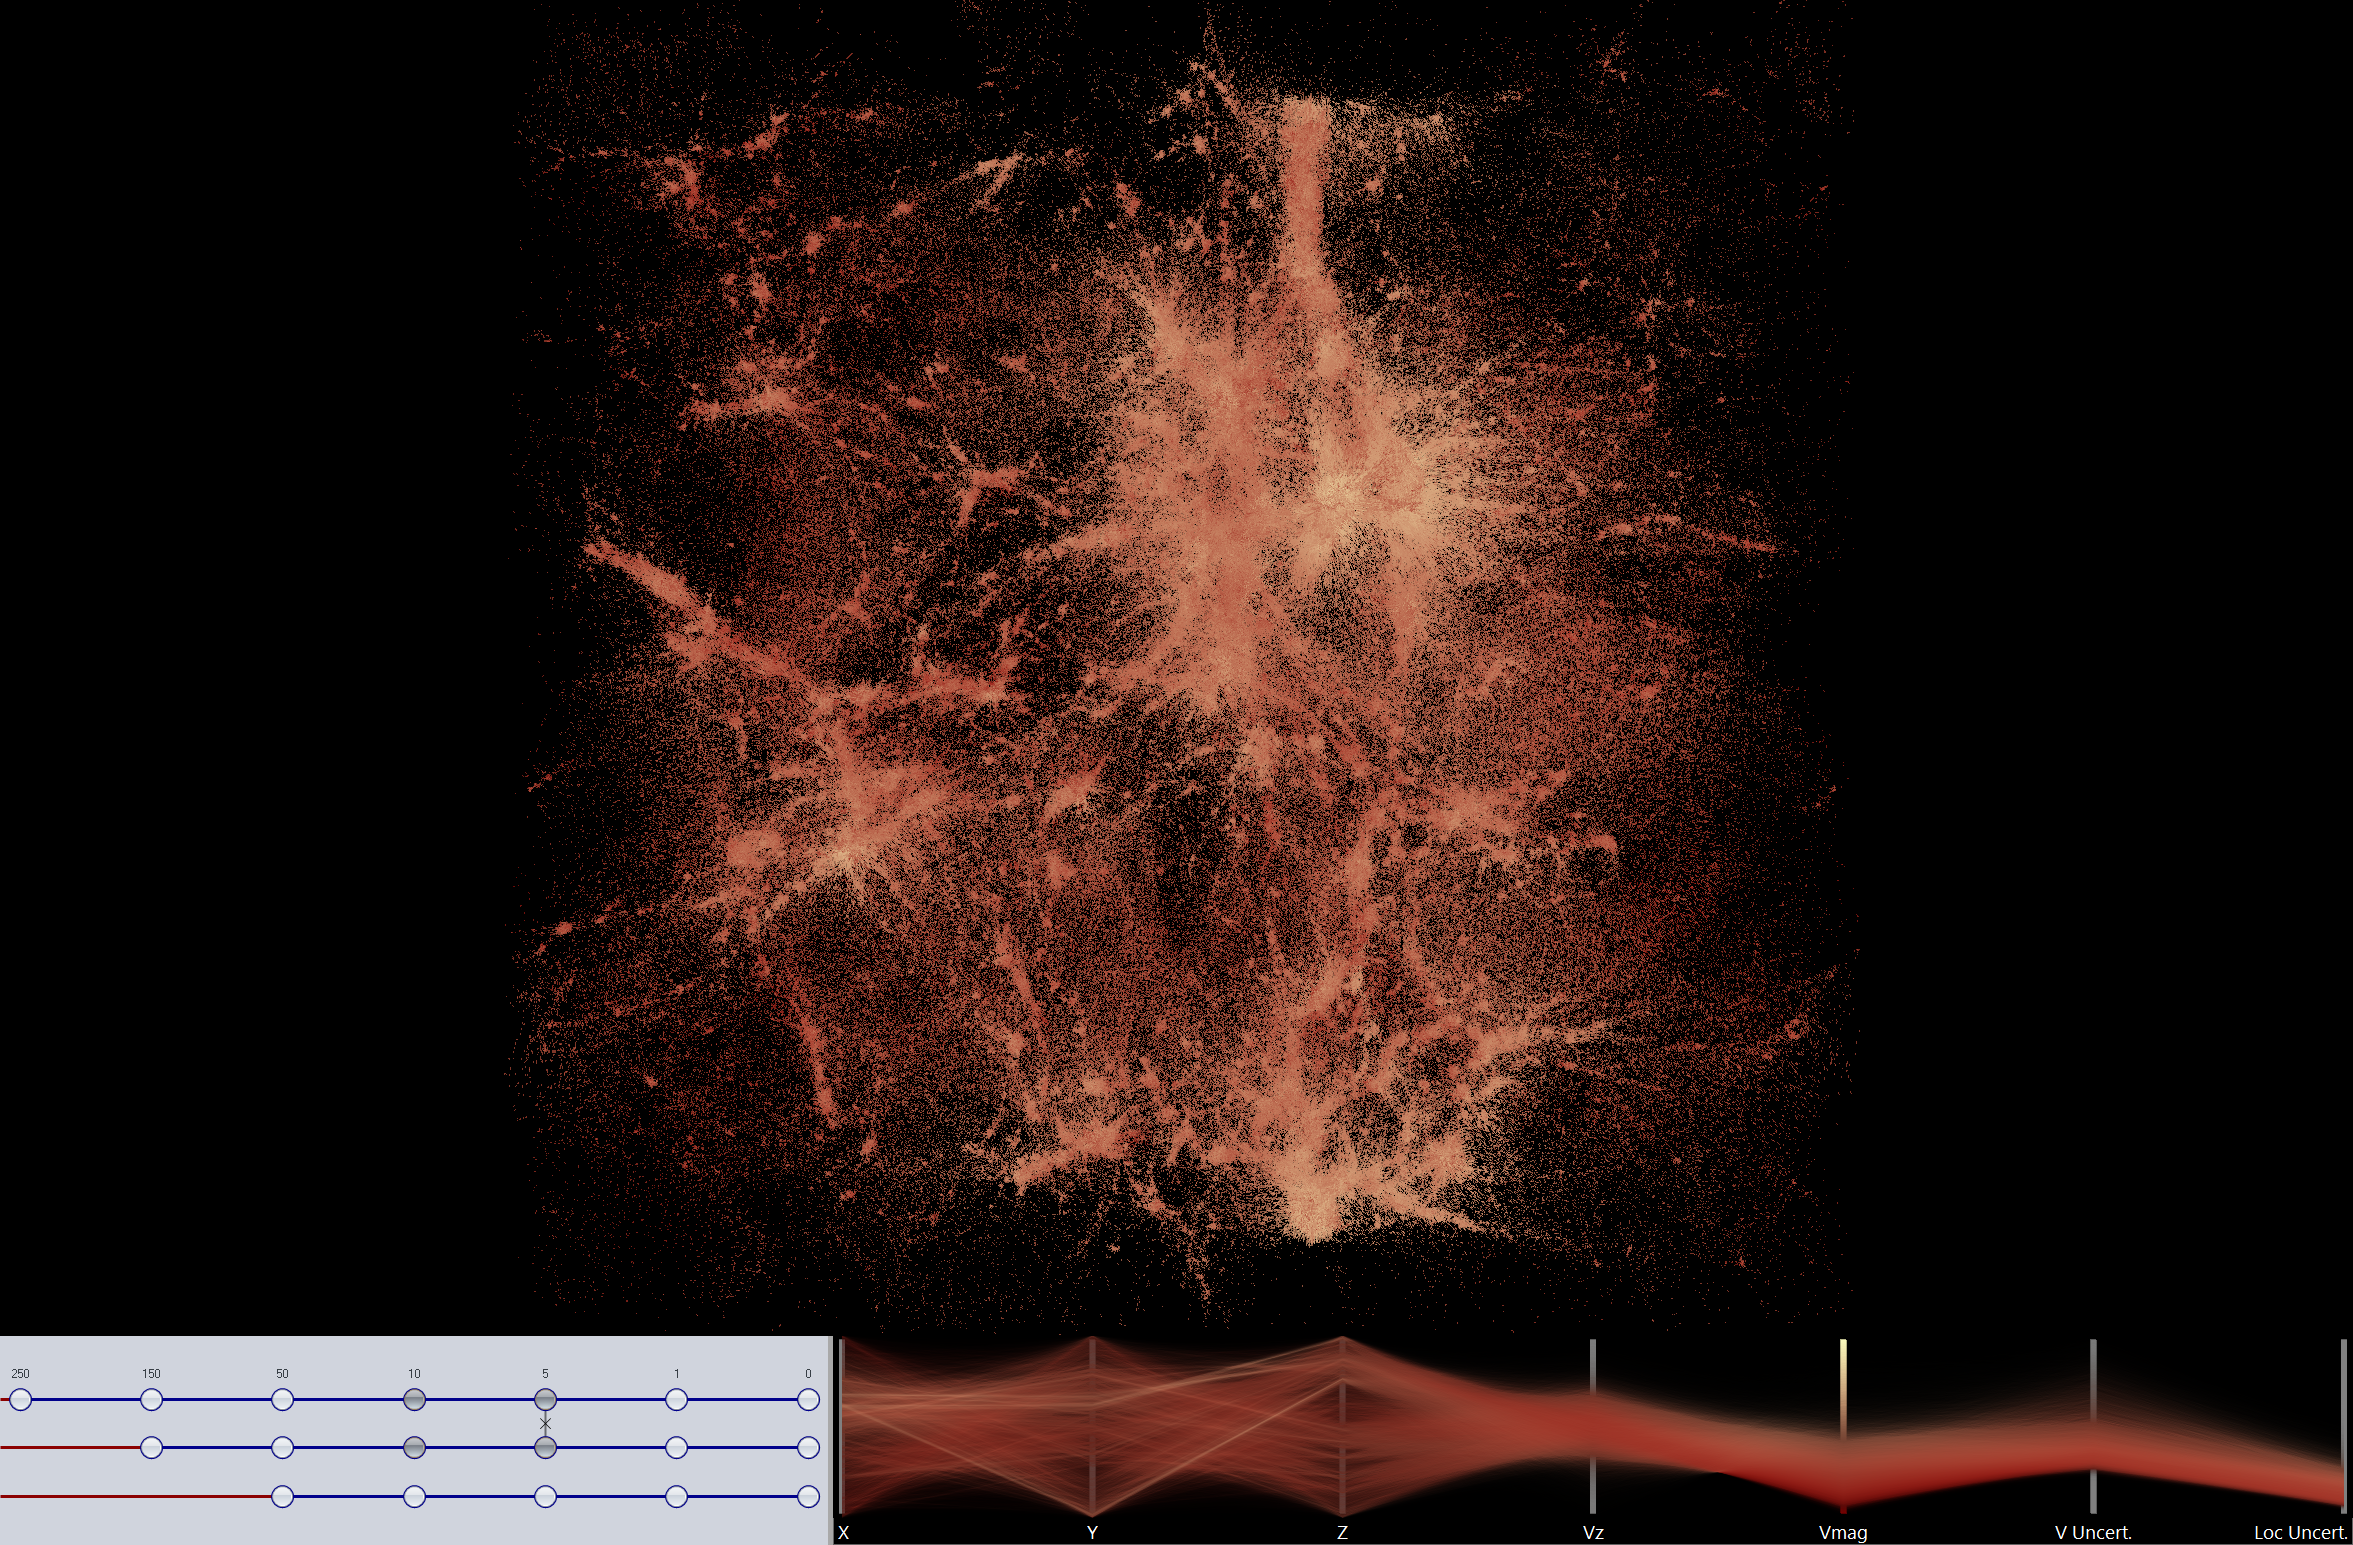
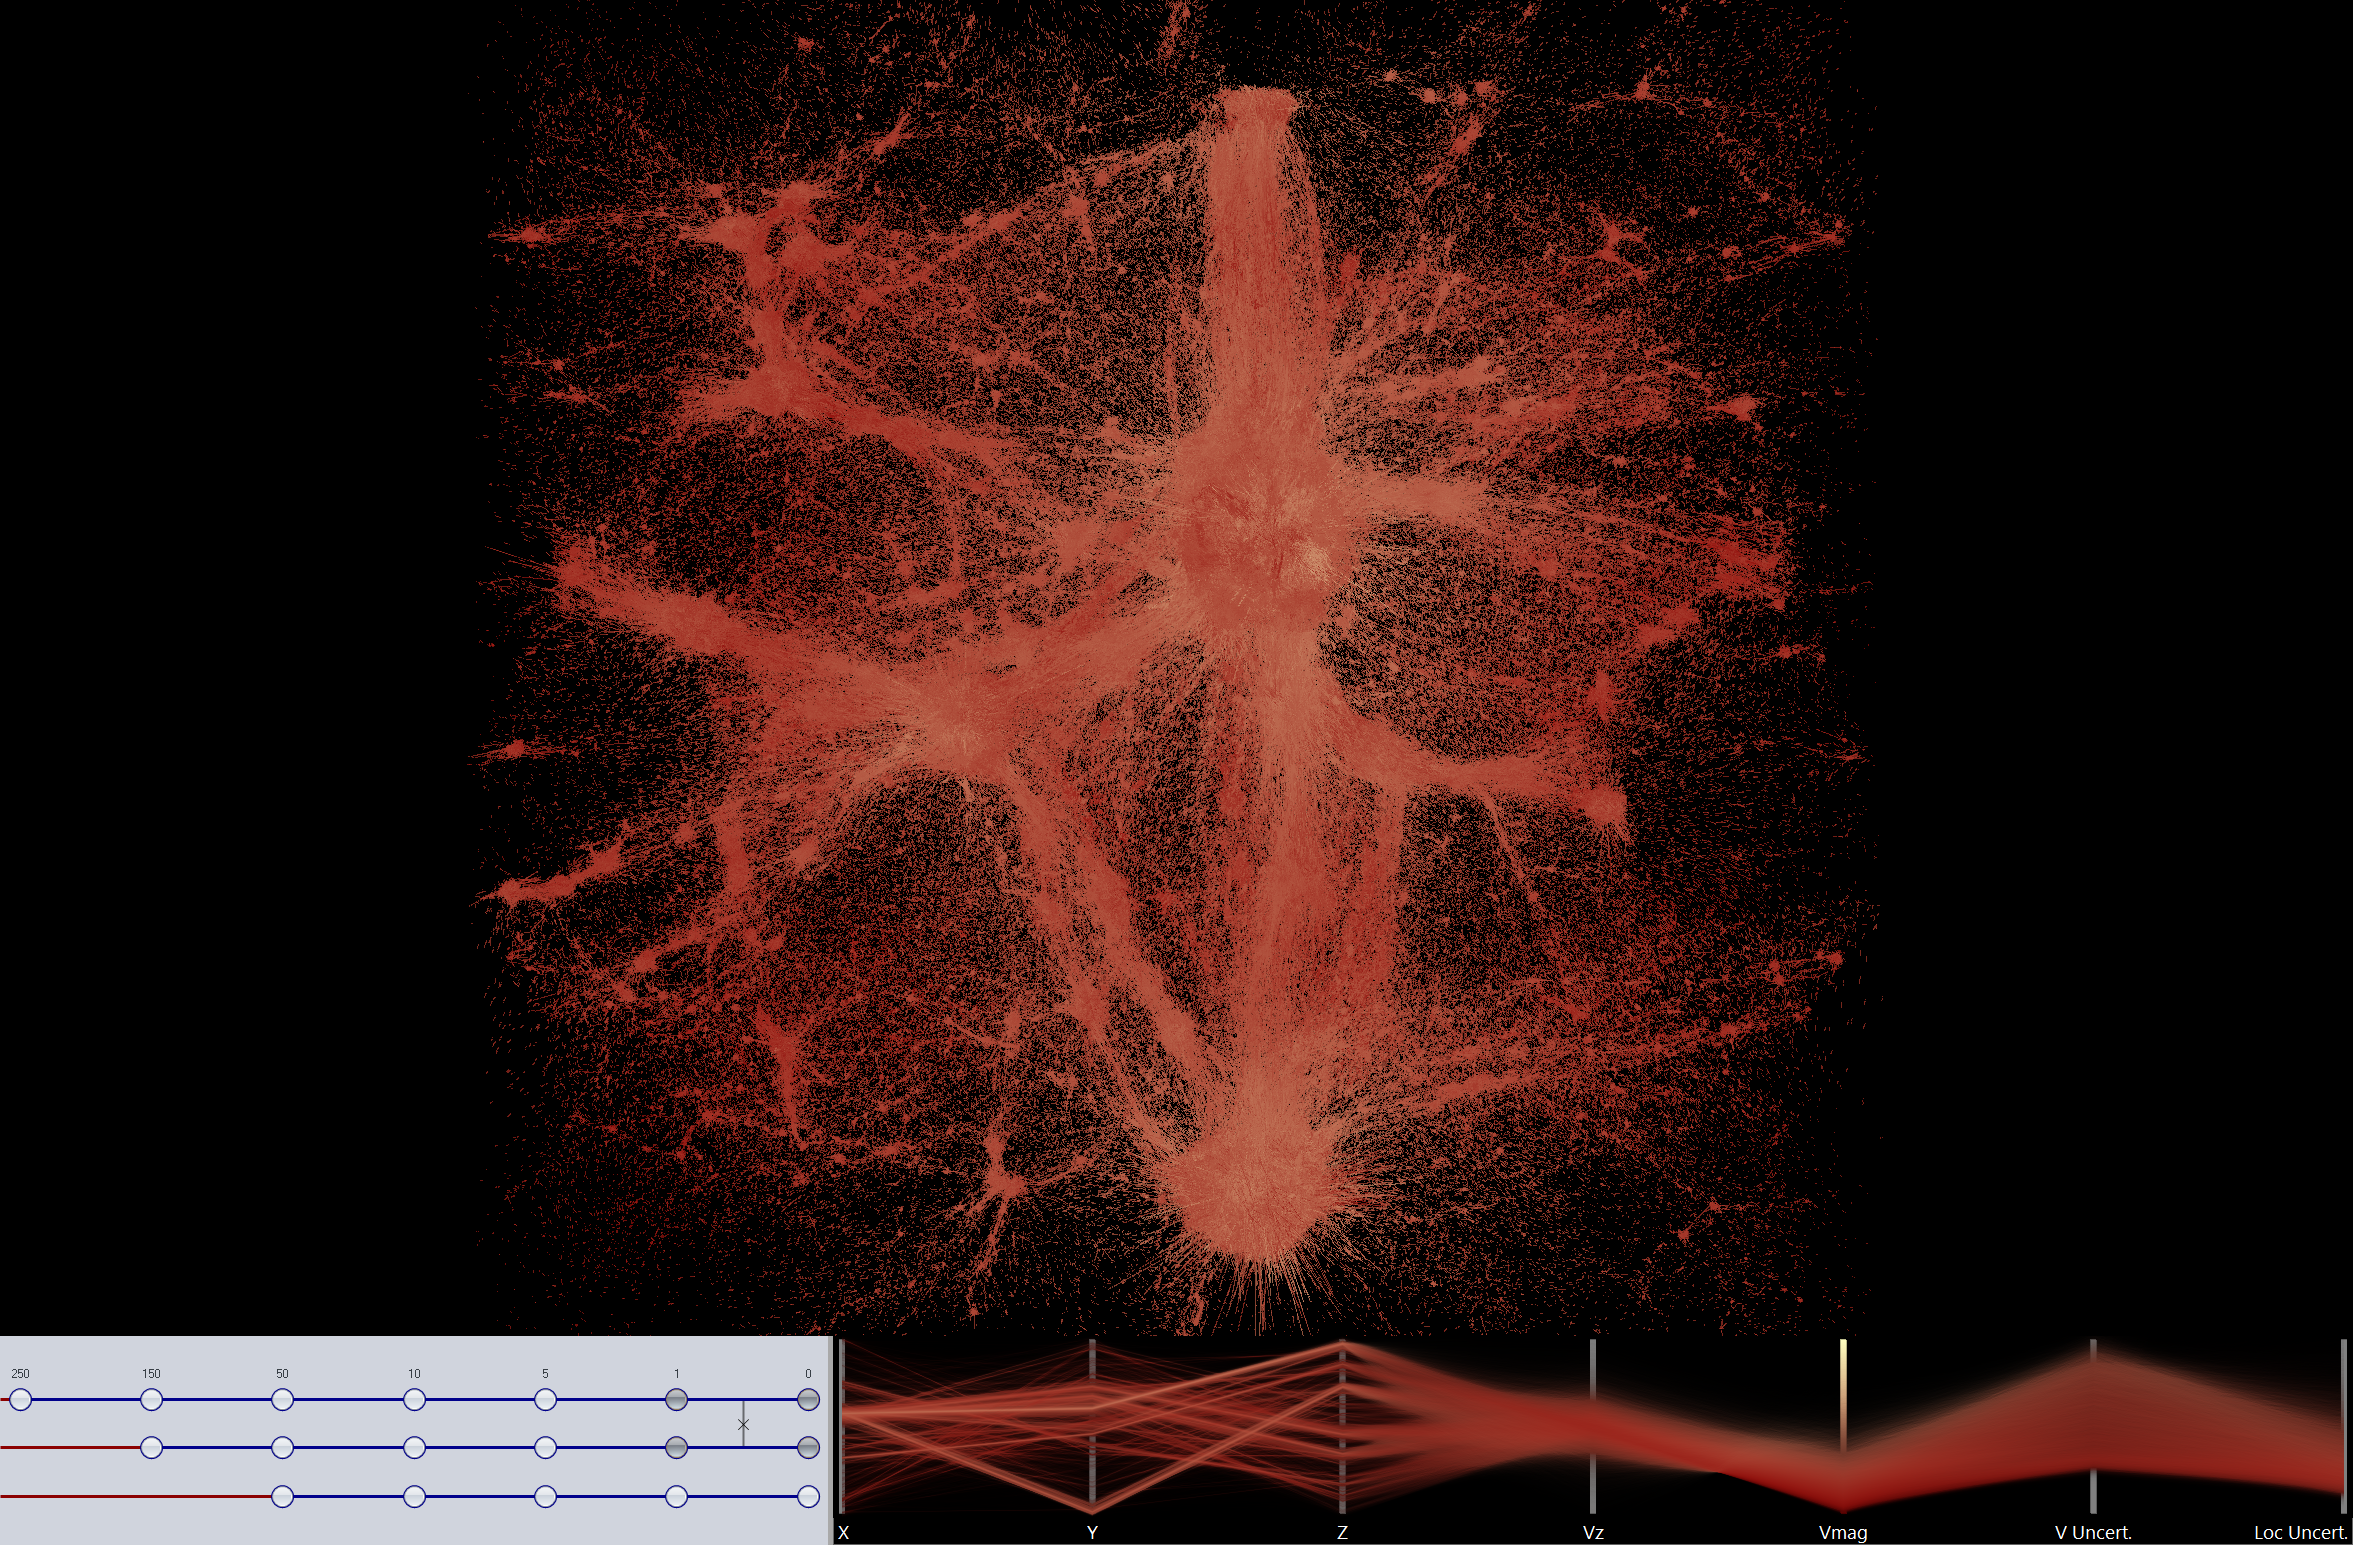
The approximated datasets presented a more interesting challenge, as we wanted to examine how the differences developed over time. Most cosmologists assume that they coalesce. However, we found that each particle's position and velocity varies more as time progresses. In other words the simulations diverge. The images below were rendered by drawing a line from each particle's position in one simulation to the position in a another simulation. As the simulation progresses and structures form, the lines grow larger meaning that the differences grow.
Data
All simulations were run by Katrin Heitmann at LANL. Some of the datasets can be obtained from the Cosmic Data ArXiv
Media
A video of variability as a cluster forms
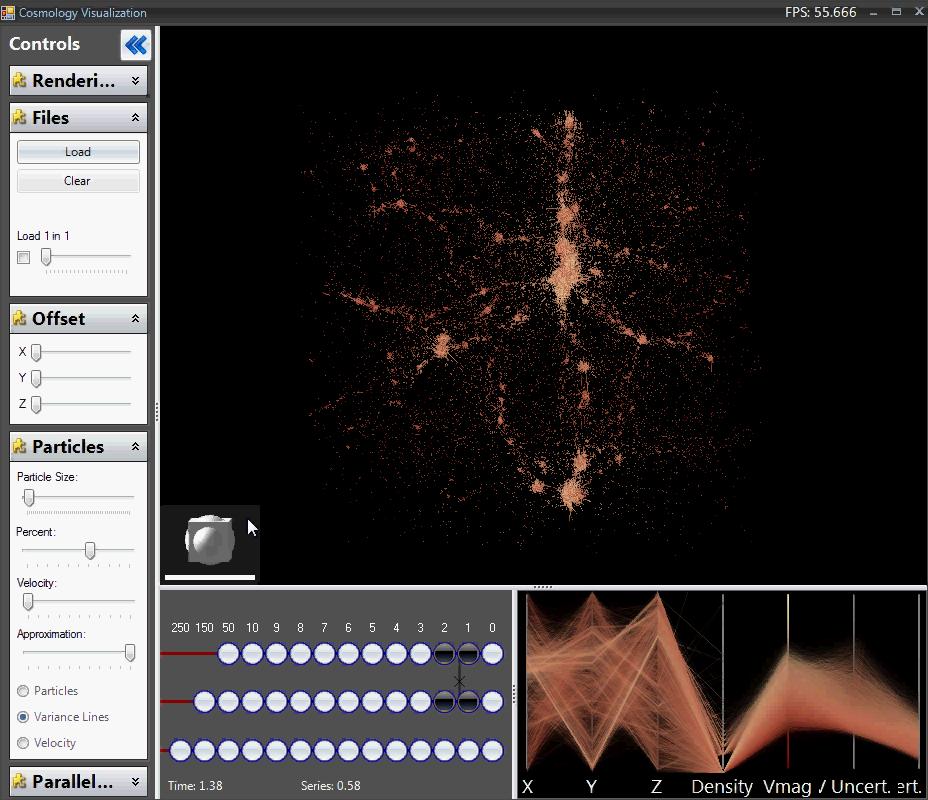
An application screenshot
A very large screenshot (8k x 8k 50MB)
A quick demo of the application shows us loading about 1% of the dataset and interacting with it